Ranking College Football's Most Experienced Teams Ahead of the 2026 Season
A comprehensive breakdown of all 138 FBS rosters, analyzing overall, offensive, and defensive experience levels for the upcoming 2026 season.
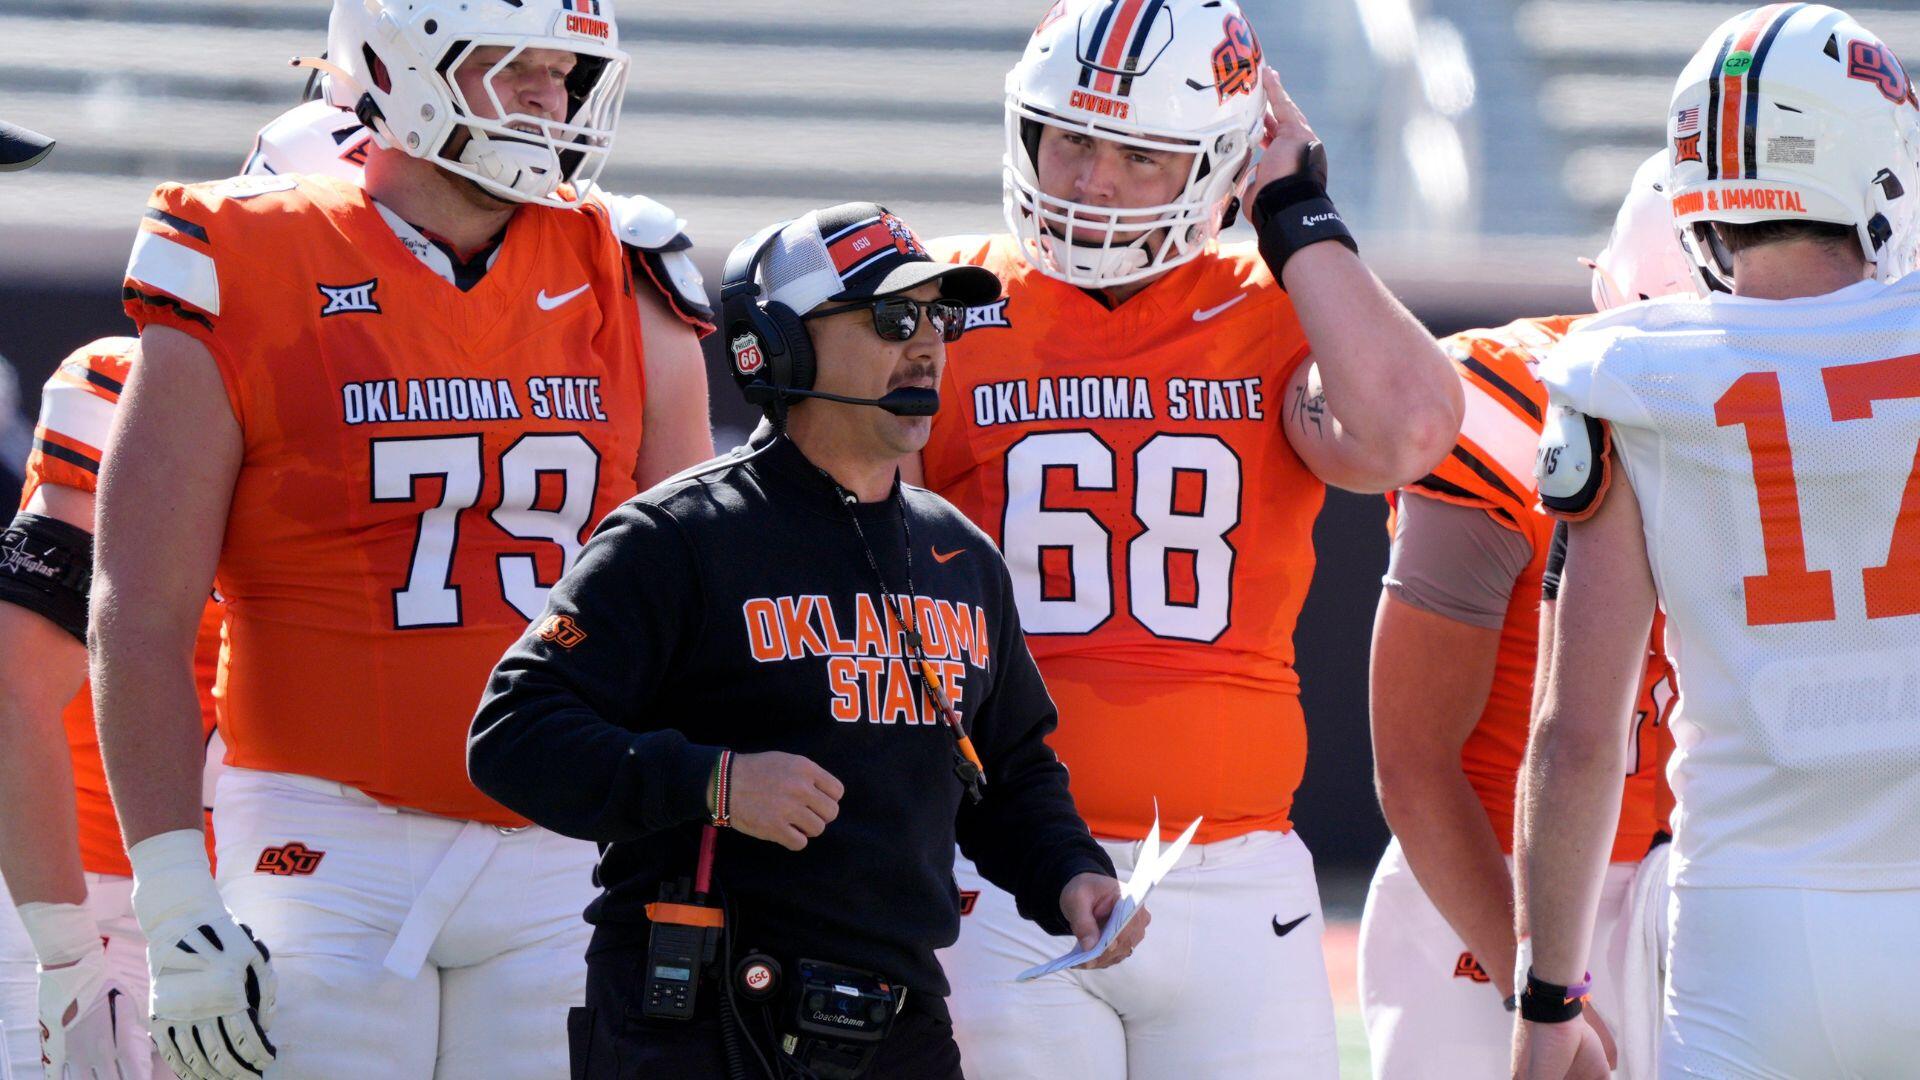
New Oklahoma State coach Eric Morris inherited a program that went 1-11 last season and hasn't won a conference game in more than two years. So naturally, he tore much of it down and rebuilt it. The Cowboys rank 134th nationally with just 10% of their snaps returning from last season's roster. And yet, entering 2026, Oklahoma State sits third in the country in total career FBS snaps and fourth in games played.
A decade ago, building an experienced roster meant recruiting well, developing players, and waiting for them to mature. Now, programs can rebuild experience almost overnight by adding proven college veterans from across the country.
That shift matters because experience still shows up in winning rosters. It's not a perfect measure of success, but teams that play deep into January are increasingly built around players who have already handled college football's physical demands, weekly grind and high-pressure moments. In theory, that kind of roster should be better than one with lesser experience.
College football teams generating buzz ahead of 2026: LSU, Notre Dame, USC offseason hype builds Cody Nagel
Using data from TruMedia, CBS Sports analyzed every FBS roster entering the season, ranking teams by total career experience while also mapping where that experience is concentrated across the roster. The dataset includes offensive and defensive snaps, games played, and starts accumulated throughout players' FBS careers. Special teams contributors such as kickers, punters, and long snappers are not included.
Because the data is limited to FBS competition, newcomers North Dakota State and Sacramento State appear at the bottom of the experience rankings.
Positional breakdowns are based on Pro Football Focus classifications to provide a consistent framework across all 138 FBS programs. As a result, some players may be grouped differently than they are listed on their school's official roster. Experience totals are attributed to a player's primary position designation rather than where they lined up on every snap.
In the coming weeks, we'll build on that foundation by examining returning offensive and defensive production in greater detail, identifying the teams that not only bring back experience but also proven playmaking and efficiency across the field.
But first, let's see which teams enter 2026 with the most experienced rosters in college football.
Overall experience
Team Total Snaps Off. Snaps (Rank) Def. Snaps (Rank) Games (Rank) Starts (Rank)
1. Virginia
39,158
20,870 (1)
18,288 (2)
1,314 (1)
571 (1)
2. Texas Tech
35,838
17,072 (6)
18,766 (1)
1,115 (4)
483 (3)
3. Oklahoma State
34,621
16,965 (7)
17,656 (3)
1,111 (5)
458 (5)
4. Ole Miss
32,794
15,982 (11)
16,812 (5)
1,072 (6)
455 (6)
5. Houston
32,439
18,538 (2)
13,901 (17)
986 (16)
489 (2)
6. UCLA
32,359
18,296 (4)
14,063 (15)
1,121 (3)
419 (8)
7. Texas A&M
31,368
14,653 (16)
16,715 (6)
1,062 (7)
422 (7)
8. Indiana
30,540
15,653 (13)
14,887 (11)
921 (26)
462 (4)
9. Auburn
29,363
16,664 (8)
12,699 (30)
1,003 (13)
401 (9)
10. Vanderbilt
29,203
12,371 (34)
16,832 (4)
1,160 (2)
397 (12)
11. SMU
29,018
14,908 (14)
14,110 (14)
1,028 (10)
336 (37)
12. Virginia Tech
28,439
14,394 (20)
14,045 (16)
1,013 (11)
359 (24)
13. LSU
27,993
14,752 (15)
13,241 (24)
950 (24)
390 (13)
14. Nebraska
27,982
16,499 (9)
11,483 (47)
1,042 (9)
399 (11)
15. Baylor
27,793
14,523 (18)
13,270 (23)
1,004 (12)
353 (27)
16. South Carolina
27,742
18,381 (3)
9,361 (72)
956 (22)
385 (16)
17. Penn State
27,562
13,263 (28)
14,299 (13)
973 (19)
400 (10)
18. California
27,293
16,406 (10)
10,887 (55)
968 (20)
326 (39)
19. Arizona State
27,202
12,577 (32)
14,625 (12)
927 (25)
374 (18)
20. Texas
27,120
13,308 (27)
13,812 (19)
986 (16)
366 (20)
21. Oklahoma
27,089
17,353 (5)
9,736 (67)
911 (27)
368 (19)
22. UCF
26,945
11,514 (42)
15,431 (8)
892 (33)
378 (17)
23. Tennessee
26,740
11,242 (47)
15,498 (7)
906 (28)
360 (23)
24. Colorado
26,384
13,514 (25)
12,870 (27)
871 (41)
389 (14)
25. Kansas
26,341
11,412 (45)
14,929 (10)
892 (33)
366 (20)
26. Florida
26,059
12,931 (30)
13,128 (25)
954 (23)
339 (35)
27. Maryland
25,951
13,667 (24)
12,284 (35)
883 (37)
343 (32)
28. Louisville
25,871
14,101 (21)
11,770 (42)
869 (43)
387 (15)
29. Miami
25,739
10,767 (53)
14,972 (9)
1,001 (14)
348 (30)
30. BYU
25,407
12,006 (40)
13,401 (22)
982 (18)
326 (39)
31. Ohio State
25,251
14,067 (22)
11,184 (52)
968 (20)
352 (28)
32. Washington
25,219
12,156 (37)
13,063 (26)
757 (67)
358 (25)
33. South Florida
25,145
13,897 (23)
11,248 (51)
1,053 (8)
283 (53)
34. Arizona
25,116
11,466 (43)
13,650 (20)
813 (53)
357 (26)
35. Florida State
25,108
13,348 (26)
11,760 (44)
897 (32)
362 (22)
36. Oregon
24,938
12,298 (36)
12,640 (32)
889 (35)
342 (33)
37. West Virginia
24,620
14,584 (17)
10,036 (61)
804 (56)
342 (33)
38. Arkansas
24,598
13,074 (29)
11,524 (46)
882 (38)
317 (41)
39. Illinois
24,417
14,409 (19)
10,008 (62)
833 (50)
350 (29)
40. Tulsa
24,152
11,406 (46)
12,746 (28)
880 (39)
309 (43)
41. Pittsburgh
23,765
12,371 (34)
11,394 (50)
774 (65)
331 (38)
42. Georgia
23,745
11,010 (50)
12,735 (29)
991 (15)
306 (45)
43. Michigan State
23,552
12,084 (39)
11,468 (48)
824 (51)
339 (35)
44. Minnesota
23,266
11,431 (44)
11,835 (40)
793 (61)
345 (31)
45. Missouri
23,027
15,832 (12)
7,195 (93)
879 (40)
316 (42)
46. Notre Dame
22,813
8,933 (75)
13,880 (18)
906 (28)
307 (44)
47. Northwestern
22,383
10,693 (55)
11,690 (45)
887 (36)
297 (47)
48. Mississippi State
22,144
10,272 (60)
11,872 (39)
841 (48)
253 (67)
49. TCU
21,999
9,634 (67)
12,365 (33)
786 (63)
290 (51)
50. Kentucky
21,880
11,938 (41)
9,942 (63)
810 (55)
303 (46)
51. Memphis
21,767
10,696 (54)
11,071 (53)
752 (70)
277 (57)
52. Liberty
21,497
12,930 (31)
8,567 (79)
867 (44)
279 (54)
53. Stanford
21,438
9,435 (69)
12,003 (37)
749 (71)
286 (52)
54. Purdue
21,240
9,800 (64)
11,440 (49)
849 (46)
262 (61)
55. Clemson
20,891
10,002 (61)
10,889 (54)
900 (30)
228 (76)
56. Miami (Ohio)
20,828
8,496 (77)
12,332 (34)
871 (41)
258 (62)
57. Georgia Tech
20,719
8,060 (82)
12,659 (31)
779 (64)
267 (59)
58. Tulane
20,687
8,924 (76)
11,763 (43)
900 (30)
220 (80)
58. USC
20,687
10,341 (58)
10,346 (58)
709 (78)
291 (50)
60. UNLV
20,555
12,557 (33)
7,998 (86)
850 (45)
245 (74)
61. Wake Forest
20,531
7,037 (96)
13,494 (21)
739 (73)
292 (48)
62. Cincinnati
20,490
8,399 (79)
12,091 (36)
734 (74)
292 (48)
63. Kansas State
20,284
11,100 (48)
9,184 (77)
795 (58)
257 (63)
64. Florida Atlantic
20,278
9,413 (70)
10,865 (56)
795 (58)
254 (64)
65. Rutgers
20,116
10,918 (52)
9,198 (76)
761 (66)
279 (54)
66. San Diego State
20,115
10,424 (57)
9,691 (68)
797 (57)
264 (60)
67. Utah
19,953
9,843 (63)
10,110 (59)
790 (62)
254 (64)
68. Boise State
19,854
10,649 (56)
9,205 (75)
795 (58)
254 (64)
69. Michigan
19,817
8,035 (83)
11,782 (41)
755 (69)
278 (56)
70. Georgia Southern
19,810
9,181 (72)
10,629 (57)
814 (52)
251 (68)
71. Duke
19,765
12,155 (38)
7,610 (88)
744 (72)
248 (70)
72. Alabama
19,502
7,543 (89)
11,959 (38)
840 (49)
275 (58)
73. NC State
19,428
11,066 (49)
8,362 (80)
690 (80)
248 (70)
74. Wisconsin
18,958
9,664 (66)
9,294 (73)
813 (53)
247 (73)
75. Arkansas State
18,583
9,700 (65)
8,883 (78)
669 (84)
239 (75)
76. Syracuse
18,339
9,066 (73)
9,273 (74)
757 (67)
248 (70)
77. UTSA
18,015
10,959 (51)
7,056 (95)
844 (47)
184 (89)
78. Iowa State
17,513
7,723 (88)
9,790 (65)
723 (76)
217 (82)
79. Kennesaw State
17,153
7,044 (95)
10,109 (60)
581 (98)
210 (83)
80. New Mexico
17,085
7,506 (90)
9,579 (70)
544 (103)
250 (69)
81. Boston College
16,876
7,087 (94)
9,789 (66)
678 (83)
210 (83)
82. Utah State
16,836
6,902 (100)
9,934 (64)
604 (91)
219 (81)
83. North Texas
16,637
8,454 (78)
8,183 (81)
725 (75)
204 (85)
84. Marshall
16,500
9,934 (62)
6,566 (97)
600 (93)
221 (79)
85. Texas State
15,980
7,861 (87)
8,119 (82)
680 (82)
181 (94)
86. New Mexico State
15,853
6,236 (105)
9,617 (69)
606 (90)
225 (77)
87. Fresno State
15,305
7,250 (92)
8,055 (85)
684 (81)
223 (78)
88. FIU
14,988
5,582 (113)
9,406 (71)
618 (88)
158 (100)
89. Western Kentucky
14,682
9,250 (71)
5,432 (109)
607 (89)
183 (91)
90. Hawaii
14,472
7,909 (86)
6,563 (98)
706 (79)
179 (95)
91. Army
14,388
10,324 (59)
4,064 (129)
594 (96)
202 (86)
92. Louisiana
14,299
8,983 (74)
5,316 (111)
595 (95)
169 (97)
93. Temple
14,267
9,522 (68)
4,745 (122)
584 (97)
182 (93)
94. East Carolina
14,112
7,932 (84)
6,180 (101)
713 (77)
124 (120)
95. Delaware
13,995
8,399 (79)
5,596 (105)
465 (119)
187 (88)
96. Washington State
13,316
6,960 (97)
6,356 (100)
639 (85)
143 (111)
97. Eastern Michigan
13,239
6,012 (107)
7,227 (92)
500 (113)
188 (87)
98. North Carolina
13,060
5,655 (112)
7,405 (89)
599 (94)
183 (91)
99. Troy
13,018
6,927 (98)
6,091 (103)
560 (100)
138 (114)
100. UConn
12,940
5,002 (122)
7,938 (87)
620 (87)
142 (112)
101. Western Michigan
12,934
7,914 (85)
5,020 (115)
577 (99)
174 (96)
102. Colorado State
12,898
4,839 (124)
8,059 (84)
626 (86)
140 (113)
103. Oregon State
12,783
6,615 (102)
6,168 (102)
519 (109)
184 (89)
104. Rice
12,522
5,245 (117)
7,277 (91)
604 (91)
151 (104)
105. Navy
12,461
6,008 (108)
6,453 (99)
521 (107)
166 (98)
106. UAB
12,457
7,249 (93)
5,208 (113)
552 (101)
155 (101)
107. Jacksonville State
12,450
5,061 (120)
7,389 (90)
548 (102)
155 (101)
108. Coastal Carolina
12,392
5,300 (116)
7,092 (94)
527 (105)
149 (106)
109. Louisiana Tech
12,064
7,417 (91)
4,647 (124)
472 (118)
149 (106)
110. Iowa
11,779
6,784 (101)
4,995 (116)
527 (105)
148 (108)
111. Nevada
11,739
6,169 (106)
5,570 (106)
515 (110)
151 (104)
112. Akron
11,588
5,953 (109)
5,635 (104)
495 (115)
145 (109)
113. Air Force
11,563
4,677 (127)
6,886 (96)
478 (117)
155 (101)
114. Central Michigan
11,387
8,082 (81)
3,305 (133)
507 (111)
166 (98)
115. Missouri State
11,319
6,244 (104)
5,075 (114)
531 (104)
132 (115)
116. Louisiana Monroe
10,682
5,711 (111)
4,971 (117)
443 (125)
128 (118)
117. Charlotte
10,423
5,003 (121)
5,420 (110)
502 (112)
126 (119)
118. Kent State
10,335
5,426 (115)
4,909 (119)
444 (124)
130 (117)
119. Toledo
10,274
6,913 (99)
3,361 (132)
520 (108)
104 (126)
120. Old Dominion
10,226
2,116 (136)
8,110 (83)
463 (120)
114 (122)
121. Ball State
10,149
4,859 (123)
5,290 (112)
498 (114)
144 (110)
122. UMass
10,127
5,243 (118)
4,884 (120)
460 (121)
131 (116)
123. App State
10,018
5,074 (119)
4,944 (118)
439 (126)
106 (125)
124. Wyoming
9,485
4,697 (125)
4,788 (121)
455 (122)
113 (124)
125. Georgia State
9,333
6,448 (103)
2,885 (134)
445 (123)
116 (121)
126. Sam Houston
9,301
4,563 (129)
4,738 (123)
394 (133)
114 (122)
127. James Madison
9,207
4,678 (126)
4,529 (125)
487 (116)
101 (128)
128. South Alabama
9,086
5,555 (114)
3,531 (131)
400 (131)
96 (131)
129. Middle Tennessee
8,795
4,469 (130)
4,326 (126)
406 (129)
101 (128)
130. Southern Miss
8,410
5,930 (110)
2,480 (135)
410 (128)
77 (133)
131. Buffalo
8,263
4,031 (131)
4,232 (128)
357 (134)
91 (132)
132. Ohio
8,149
2,694 (134)
5,455 (108)
404 (130)
101 (128)
133. UTEP
7,729
2,258 (135)
5,471 (107)
349 (135)
103 (127)
134. San Jose State
7,243
3,596 (132)
3,647 (130)
437 (127)
71 (136)
135. Bowling Green
6,972
2,702 (133)
4,270 (127)
399 (132)
75 (134)
136. Northern Illinois
5,796
4,658 (128)
1,138 (136)
260 (136)
74 (135)
137. Sacramento State
1,937
1,396 (137)
541 (137)
_Originally reported by [CBS Sports](https://www.cbssports.com/college-football/news/college-football-most-experienced-teams-2026-rankings/)._
Comments
Loading comments…