
Examining Week 1 Losses: Which Are Most Concerning for Contenders?
Analyzing Week 1 outcomes since 2015 to determine which early-season problems have historically been most challenging for preseason contenders to overcome.
Week 1 is built for overreactions, and this year gave us a lot to work with.
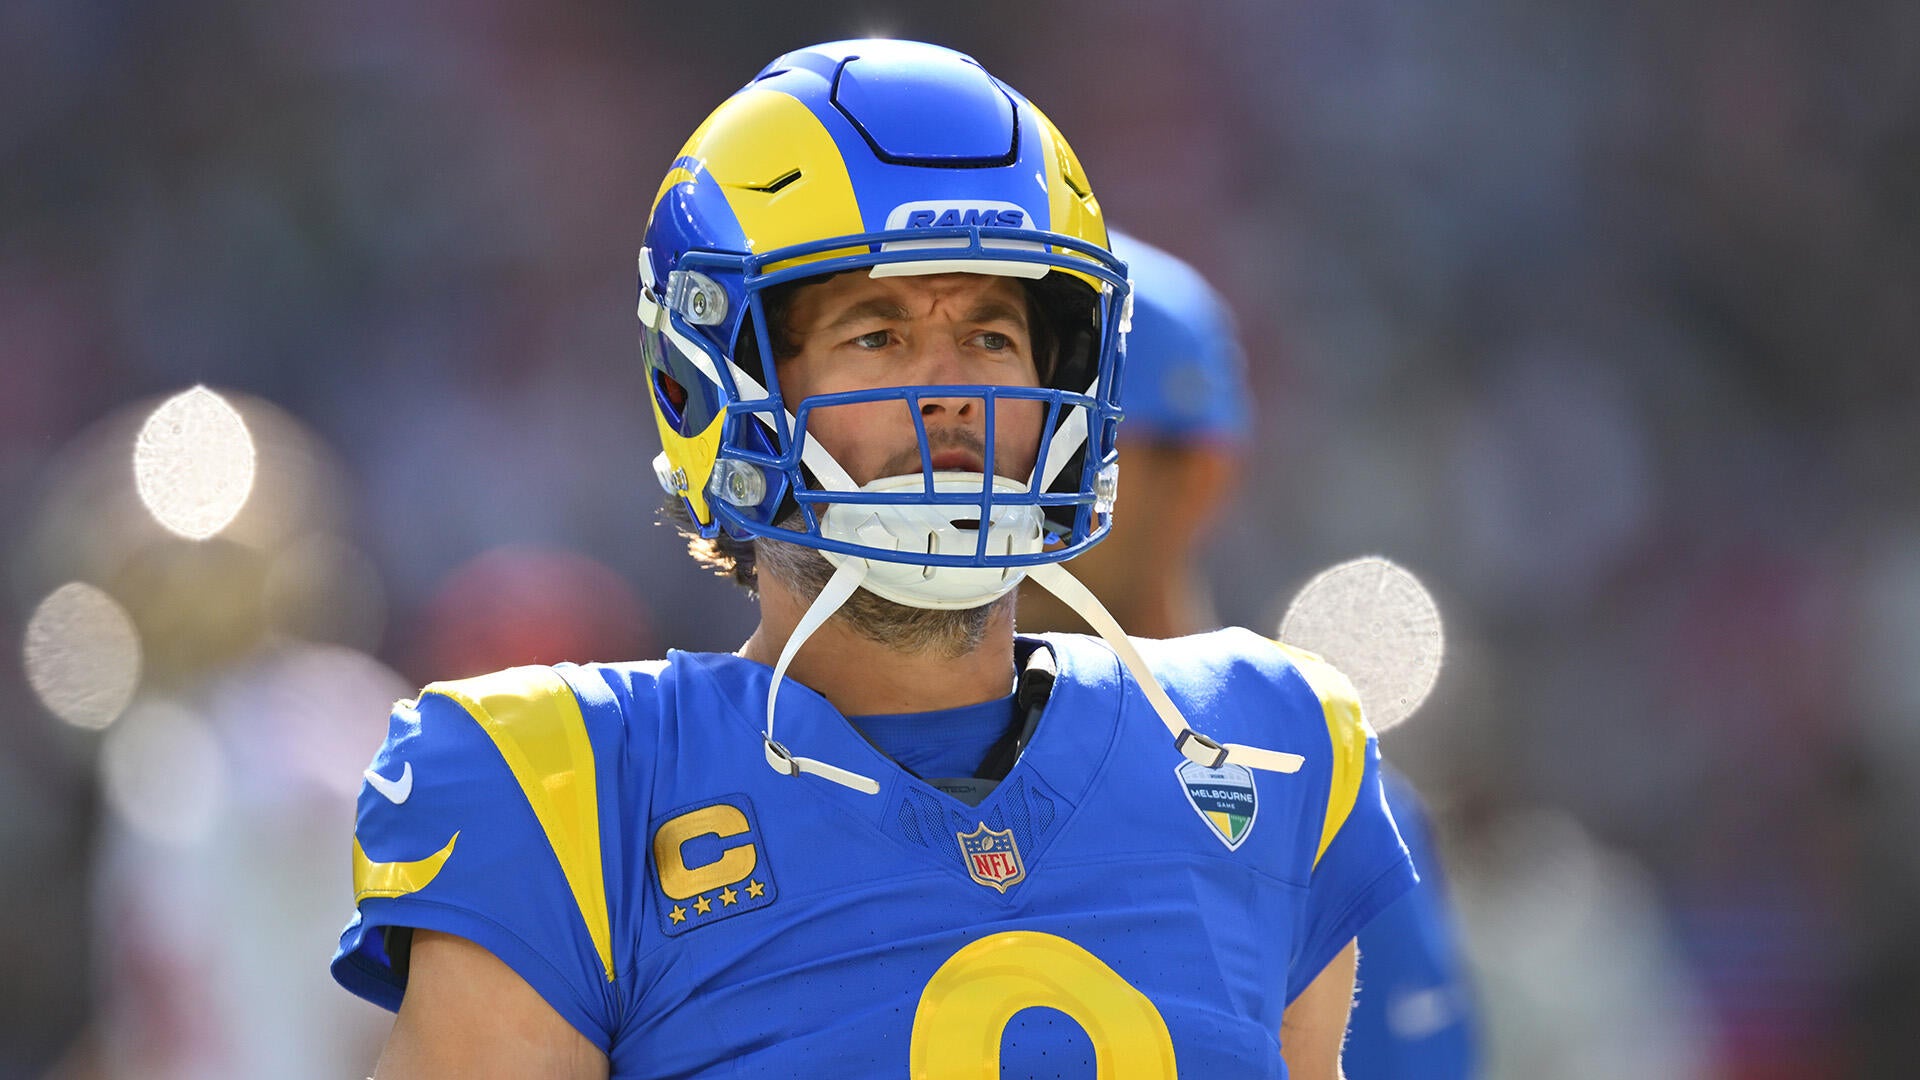
After a busy offseason , the Rams entered 2026 with borderline unrealistic Super Bowl expectations and promptly lost by 20 points to the 49ers . The Packers were cruising against the Vikings only to lose by 17. The Chargers , favored by more than a touchdown at home, lost by 12 to Arizona. New England kept things close, but a 13-10 loss to Seattle and three Drake Maye interceptions left lingering questions about the franchise quarterback who struggled through last postseason.
So which losses should actually worry us?
To find out, we went all the way back to 2015 to look at every Week 1 loss by a team that entered the season in our contender pool — the top 12 in preseason Super Bowl odds. That gave us 53 historical losses to compare with what happened over the rest of the season.
The biggest takeaway might also be the most reassuring: If your team was supposed to be good before Week 1, getting blown out wasn't much worse than a close loss. What mattered much more was how the team played.
The good news: If a contender got blown out, the blowout itself isn't the problem
A Week 1 loss matters. Preseason contenders that won their opener from 2015-2025 made the playoffs 73% of the time, while those that lost fell to 42%. But once a contender lost, the margin barely mattered — one-score losers made the playoffs 41% of the time, and teams beaten by nine or more made it roughly 43% of the time.
Preseason status
Week 1 result
Made playoffs
Contender
Won
72.6%
Contender
Lost
41.5%
Non-contender
Won
43.2%
Non-contender
Lost
19.3%
There's another way to put that into perspective: A preseason contender that lost by nine or more still made the playoffs 42.9% of the time — essentially the same rate as a non-contender that won its opener, at 43.2%.
That's the first lesson. Don't panic because of the final score. The better question is what produced it: Was it something random, situational or repeatable?
So what actually mattered?
The clearest warning signs weren't on the scoreboard: success-rate differential, sack rate allowed, offensive third-down rate and defensive third-down rate allowed.
Success rate tells us whether an offense consistently stayed on schedule. Sack rate measures how often dropbacks turned into negative plays, while third down gets at whether a team could sustain drives and get off the field.
No single number here tells the whole story, so we used the historical median for each category to separate the stronger and weaker Week 1 performances. Teams on the wrong side of the success-rate differential made the playoffs only 30% of the time, compared with 54% for teams on the other side.
One red flag was manageable; multiple red flags were much harder to overcome.
Just as important was what didn't separate the teams that bounced back from their Week 1 loss: Turnover margin, explosive-play differential and yards per play were much noisier. They helped explain individual losses far better than what happened over the next four months.
Week 1 red flags
Teams
Made playoffs
Finished below .500
Avg. wins
0-1
15
73.3%
13.3%
10.3
2
17
35.3%
41.2%
8.4
3-4
21
23.8%
61.9%
8.0
Don't misunderstand — this is not a predictive model. It's a 53-team historical sample showing which Week 1 problems were more often associated with losing seasons and which weren't. That said, it does give us a much better way to think about Week 1 than just asking who lost and by how much.
Team
Success-rate differential*
Sack rate allowed
OFF 3rd-down rate
DEF 3rd-down rate allowed
Red Flags
Rams
-5.4 pts.
0.0%
22.2%
58.3%
3
Packers
+12.3 pts.
8.7%
25.0%
53.3%
3
Chargers
+8.7 pts.
10.0%
25.0%
42.9%
2
Patriots
+10.2 pts.
8.3%
31.3%
18.2%
2
*Success-rate differential compares how often each team stayed on schedule offensively. Positive means the offense was more efficient down to down than the opponent's; negative means the opposite.
Rams: This is the loss that looks worse underneath
Los Angeles lost 27-7 to San Francisco (in Australia), but the score isn't really the reason to be concerned. The bigger issue is that the Rams came up short in three of the four areas that mattered most historically. They were worse in success rate, converted only 22% of their third downs and allowed San Francisco to convert 58%.
That particular combination has been especially unforgiving. Since 2015, preseason contenders that lost Week 1 while landing on the wrong side of both success-rate differential and defensive third-down rate allowed made the playoffs just three of 16 times (18.8%); 10 of the 16 finished below .500. Add poor offensive third-down performance — exactly what the Rams did in Australia — and only two of those nine teams made the playoffs.
That's a bad combination because the 49ers weren't just living off turnovers or a few giant plays. They repeatedly won on early downs and finished drives on third down. The Rams didn't allow a sack, won the 20-plus-yard explosive-play battle 2-1 and were only minus-one in turnovers, so this isn't an easy "everything weird went against them" explanation.
This doesn't have to be the end of the world, though. Six previous contenders showed the same three red flags in Week 1, and two still made the playoffs. The 2021 Packers opened with a 38-3 loss to New Orleans, were nearly 17 percentage points worse in success rate, went 1-for-10 on third down and allowed a 50% third-down conversion rate. They then finished 13-4 and won their division.
There's also a matchup factor worth considering: Kyle Shanahan has consistently gotten the better of Sean McVay, no matter the continent. He's now 12-7 head-to-head. Some of what looked alarming in the opener could also be the latest example of this being an especially difficult matchup for the Rams.
But the question for the Rams in Week 2 isn't whether they win by three touchdowns. It's whether they start winning early downs again. If the third-down problems show up for the second time in as many games, it gets much harder to dismiss this as an opening-week oddity.
Packers: The final score may be lying to us
Green Bay's 39-22 loss to Minnesota looks almost as bad as the Rams' on paper. But it was a completely different game.
The Packers were 12.3 percentage points better in success rate, averaged 2.4 more yards per play, and won the 20-plus-yard explosive battle 7-2. Somehow, they led for 50:34 while trailing for only 6:37. Green Bay's biggest problems showed up on money downs. They allowed four sacks, converted only 25% of their third downs, allowed Minnesota to convert 53% and watched the Vikings go 4-for-4 in the red zone. That's three red flags, but the overall performance was better than the final score made it look.
Only four historical contenders had that same combination — sacks, poor offensive third-down performance and poor defensive third-down performance despite a strong success-rate differential — and three missed the playoffs. So while Green Bay played better than the score suggests, history says those protection and third-down problems still deserve plenty of attention.
As for comps, the 2021 Titans make for a pretty good one. Tennessee was a home favorite and got demolished 38-13 by Arizona in Week 2, but they still posted a positive success-rate differential while struggling badly with sacks and third downs. The Titans recovered to finish 12-5 and win the AFC South.
Green Bay's three-red-flag game still shouldn't be treated the same as the Rams'. LA had broader down-to-down problems; the Packers' issues were more concentrated in protection and situational football.
Chargers: There were problems, but not everywhere
The Chargers had their own problems, but they weren't as widespread as what we saw from the Rams. They lost 26-14 to Arizona as an 8.5-point favorite (the real-time embodiment of "Charger-ing"), with a 10% sack rate and a 25% third-down conversion rate as the biggest concerns.
That said, Arizona was the lesser opponent on paper, so there's only so much comfort to take from the underlying numbers. The Chargers were 8.7 percentage points better in success rate, were roughly even in yards per play and finished even in 20-plus-yard plays. Arizona converted 43% of its third downs, which kept LA below the cutoff for defensive third-down rate allowed.
The Chargers also finished minus-2 in turnover margin, but historically, turnovers did almost nothing to separate the teams that bounced back from the ones that didn't. The playoff rates were nearly identical: 41% for teams with worse-than-median turnover margins, compared with 42% for teams with better-than-median turnover margins.
There is still reason to take those two issues seriously. Four historical contenders had that same combination — poor sack rate and poor offensive third-down performance — while otherwise grading out well in success rate and defensive third-down rate. Only one of the four made the playoffs.
The 2022 Packers are a fair cautionary comp for the '26 Chargers: good enough down to down, but sacks and third-down problems showed up in a 23-7 Week 1 loss to Minnesota. Green Bay eventually finished 8-9 and missed the playoffs.
The 2018 Texans offer a more encouraging precedent. They had similar sack and third-down issues after losing their opener to New England, then recovered to go 11-5. That's about where the Chargers sit right now: not a loss to shrug off, but also not evidence that everything we thought about them in August was wrong.
Patriots: This looks like the easiest loss to explain
Two things stood out in New England's 13-10 loss to Seattle: an 8% sack rate and a 31% offensive third-down conversion rate — but most of the other numbers point in the opposite direction.
The Patriots were 10.2 percentage points better in success rate, held Seattle to 18% on third down, led for 27:43 and trailed for fewer than six minutes. The problem was that they finished minus-3 in turnovers and minus-3 in 20-plus-yard plays.
And it's what makes the 2023 Bills a useful comp here. They lost their opener to the Jets despite a +10-point success-rate differential. They were sacked too often, lost the explosive-play battle and finished minus-3 in turnovers. Buffalo went on to finish 11-6 and win the AFC East.
The 2020 Buccaneers are an even better example. They lost their opener despite a +11.7-point success-rate differential, finished minus-3 in turnovers and also struggled in pass protection. They went 11-5 and won the Super Bowl. The point isn't that New England is Tampa Bay; it's that healthy down-to-down football can survive one ugly opener.
If the turnovers continue — especially from the quarterback — that's a real concern. But Week 1 looked much more like a game decided by a handful of damaging plays than one where the Patriots were consistently outplayed.
What Week 1 actually told us
One game isn't enough to decide whether a contender is still a contender after just 60 minutes of football, and the final score might be the least useful place to start. Historically, preseason contenders that lost close games and those that got blown out recovered at about the same rate. The bigger concern was when those problems kept showing up down to down. That's the distinction that matters after Week 1: It's not how ugly the loss looked, but what caused it.
That's why these 0-1 teams shouldn't be thrown into the same bucket. The Rams need to fix their down-to-down and third-down problems; Green Bay needs to clean up protection and money downs; the Chargers need to sustain drives and protect better; and the Patriots need to stop giving away possessions and giving up explosive plays.
Of the four, the Rams' loss raised the most concern, while New England's was the easiest to explain away. Green Bay and the Chargers landed somewhere in between for very different reasons. We
_Originally reported by [CBS Sports](https://www.cbssports.com/nfl/news/rams-packers-chargers-patriots-week-1-losses-that-scare-us-most/)._
Comments
Loading comments…